
ATR-Based Daily Zones
Visualise potential price reaction areas using daily opening prices and the previous day's ATR.
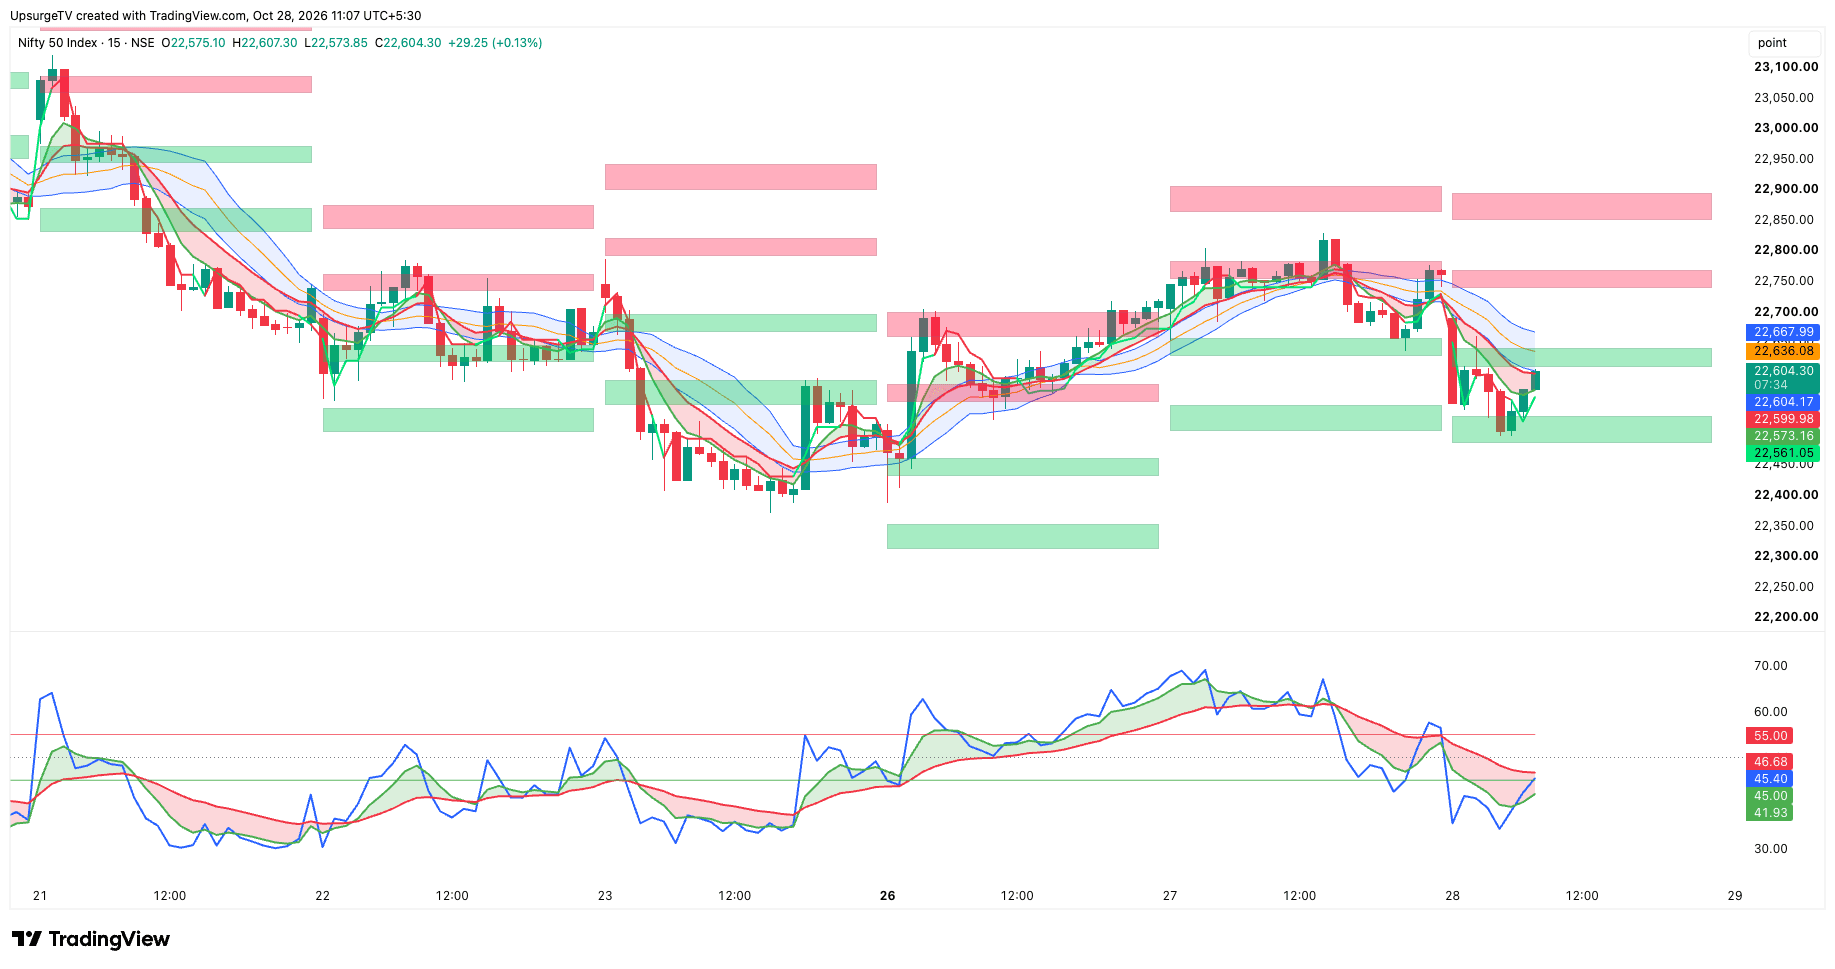
RK Bhagyavidhata is a technical analysis indicator that combines trend-following tools, momentum indicators, volatility bands, and ATR-based daily price zones into a single TradingView setup.
Win Rate
65%
Accounts using
2,374+
Indicator Access on
about the indicator
Four core modules that work together for a complete trading system
RK Bhagyavidhata is a technical analysis indicator that combines trend-following tools, momentum indicators, volatility bands, and ATR-based daily price zones into a single TradingView setup.

Visualise potential price reaction areas using daily opening prices and the previous day's ATR.

Track price movement relative to a configurable Bollinger Band system. Customise the period, standard deviation multiplier, band colours, and fill settings to suit your charting preferences.

Combine fast and slow EMAs with SuperTrend to assess price direction and potential trend shifts.

Monitor RSI alongside fast and slow EMAs calculated on RSI.
Note: Indicator can be accessed onIndicator can be accessed on
pricing
Get the indicator in your TradingCharts account.
₹999 /
Indicator Access
Indicator access in your TradingCharts (dhan) account
₹1,799 /
Indicator Access
Indicator access in your TradingCharts (dhan) account
₹2,999 /
Indicator Access
Indicator access in your TradingCharts (dhan) account
getting started
A short walkthrough of getting the indicator onto your TradingCharts
Watch this video to understand the process
instructor
Learn from experienced market practitioners
Rajesh Pandey is a full-time trader and educator with 15+ years of experience in the stock market, with a YouTube community of 69,000+ subscribers. His content covers price action, technical indicators and fundamental analysis, along with derivatives trading across indices, stocks, forex, crypto and commodities. As a mentor and educator, Rajesh focuses on helping beginners control their losses and build a more consistent, profitable approach to trading through structured learning and disciplined risk management.
faq
Everything you need to know before you get started