
Multi-timeframe analysis
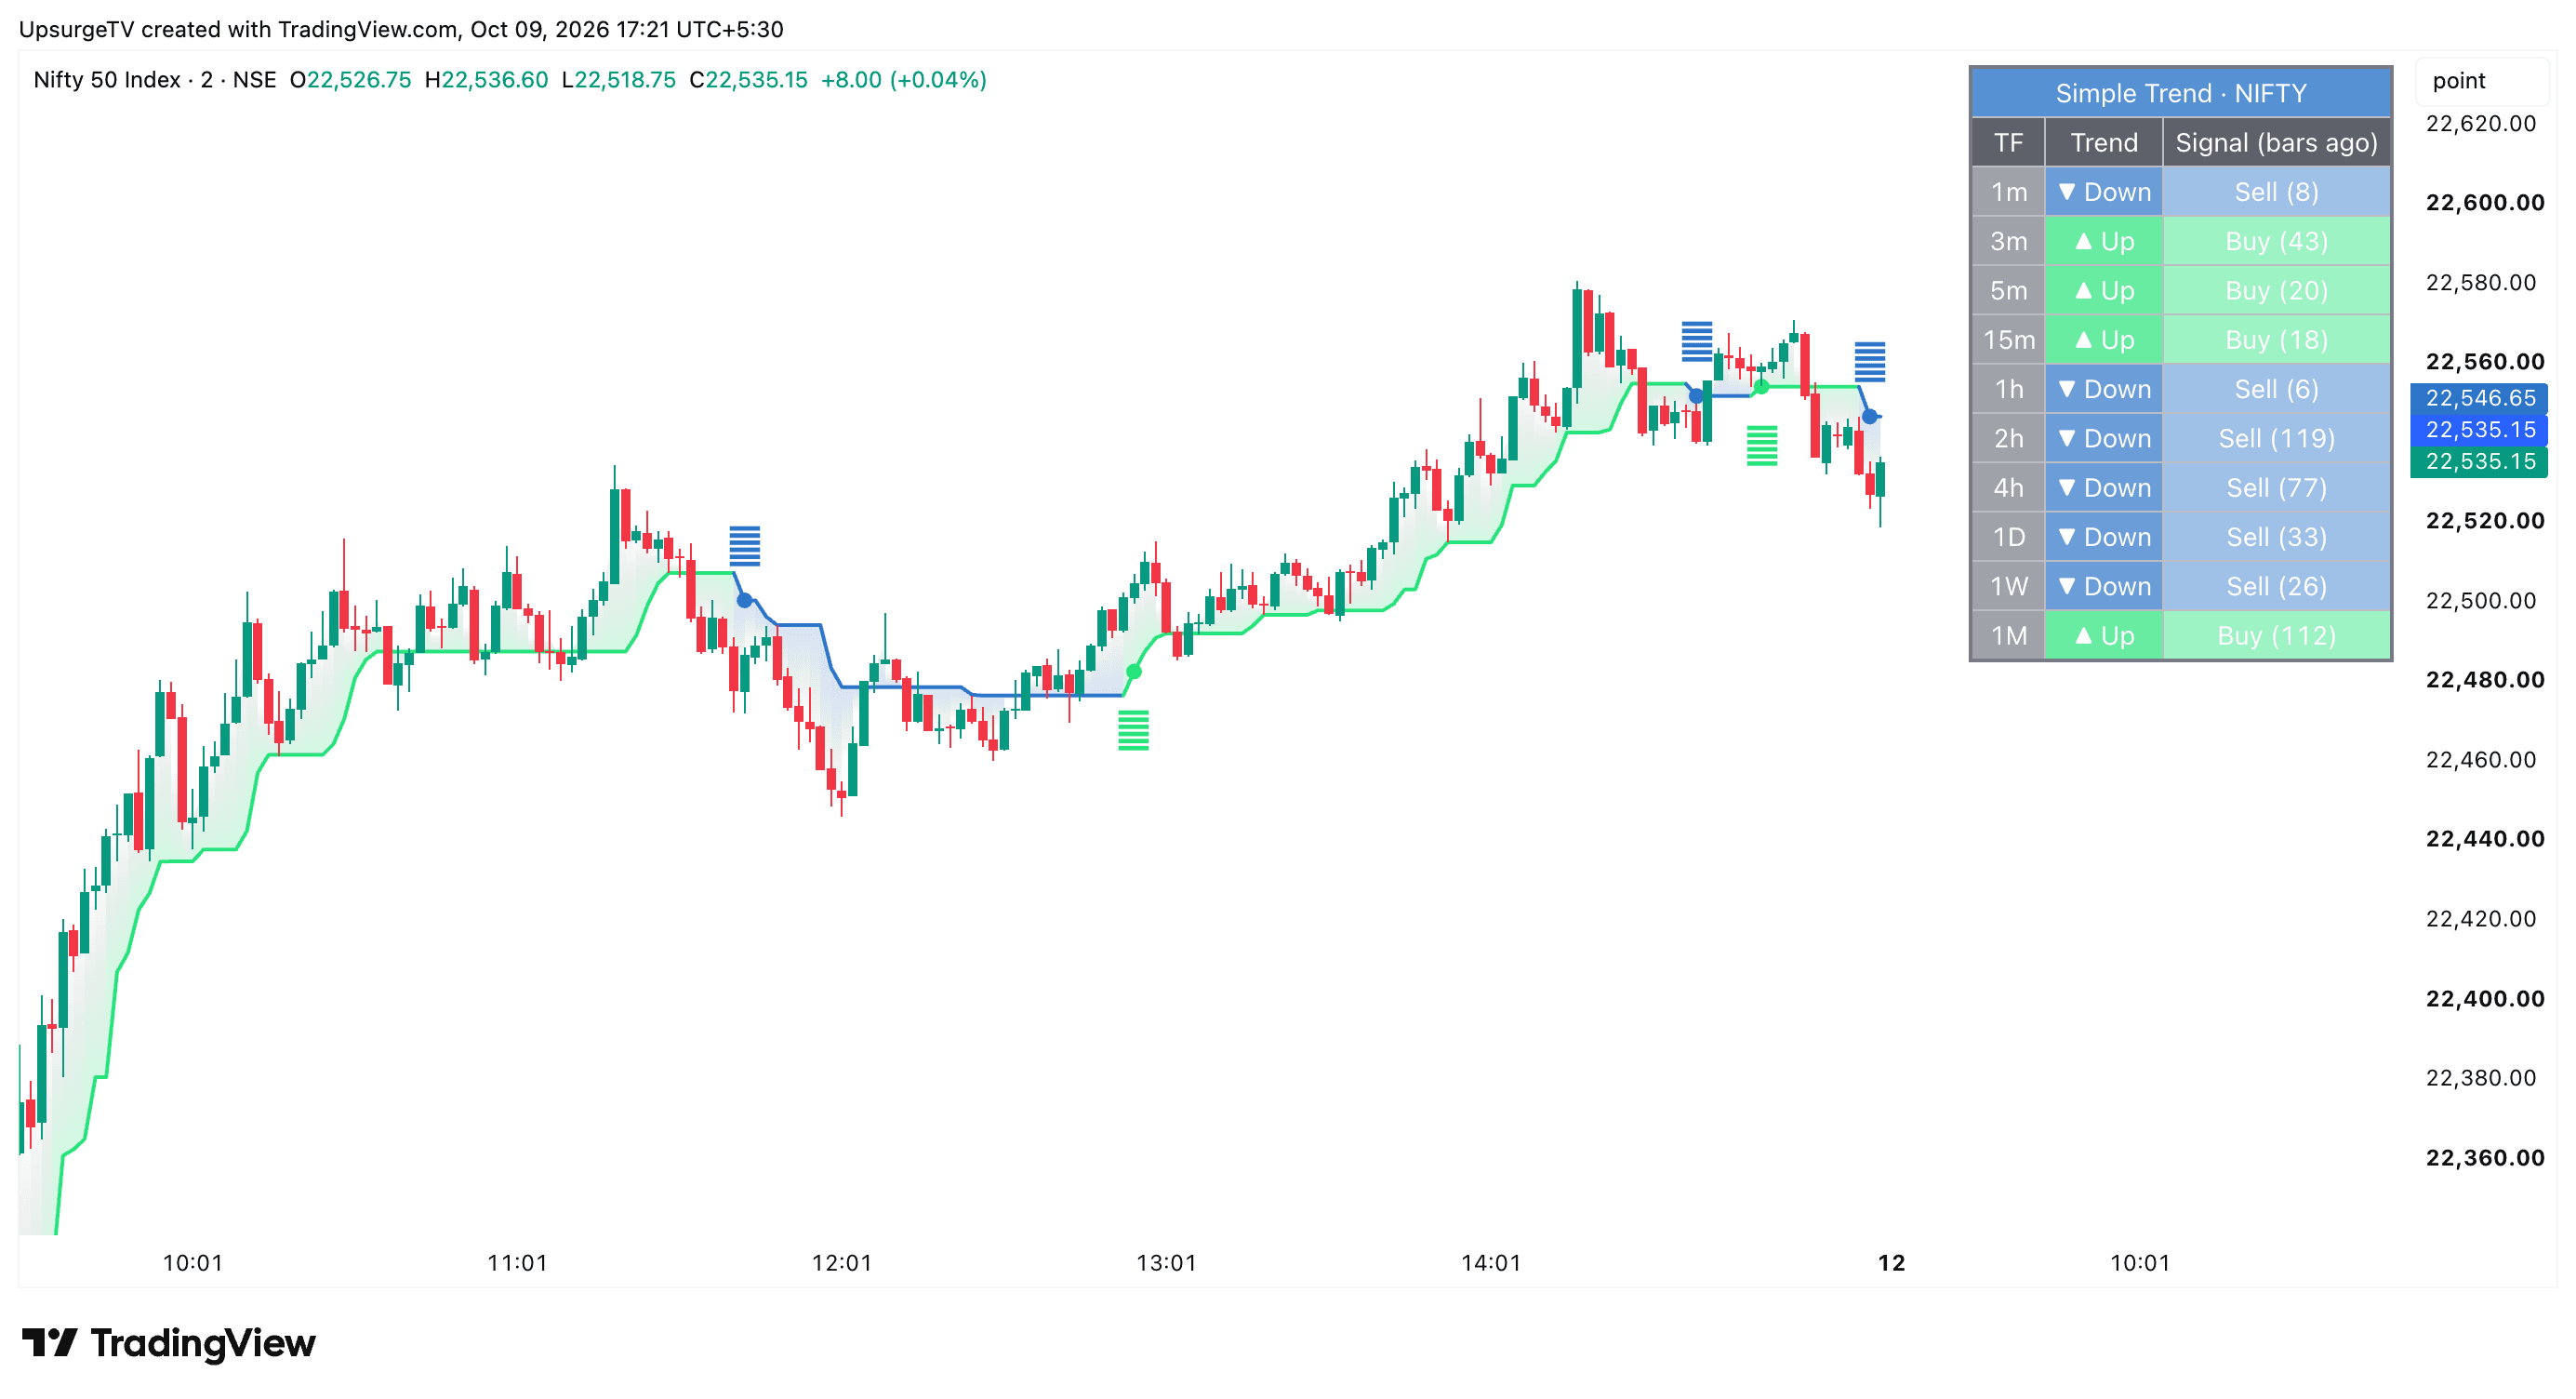
Shows market trends, buy/sell signals, and how many candles ago the last signal appeared across different timeframes.
Simple Trend helps traders easily identify market trends and possible buy and sell opportunities. The indicator is easy to use, fully customizable, and helps traders understand market direction at a glance.
Win Rate
70%
Accounts using
2,339+
Indicator Access on
about the indicator
Four core modules that work together for a complete trading system
Simple Trend helps traders easily identify market trends and possible buy and sell opportunities. The indicator is easy to use, fully customizable, and helps traders understand market direction at a glance.

Shows market trends, buy/sell signals, and how many candles ago the last signal appeared across different timeframes.

Track changes in market direction with a visual trend line.

Adjust trend sensitivity, signal size, colors, and dashboard preferences.

Option to use confirmed bars for more stable signals and reduced repainting in the multi-timeframe dashboard.
Note: Indicator can be accessed onIndicator can be accessed on
pricing
Get the indicator in your TradingCharts account.
₹499 /
Indicator Access
Indicator access in your TradingCharts (dhan) account
₹999 /
Indicator Access
Indicator access in your TradingCharts (dhan) account
getting started
A short walkthrough of getting the indicator onto your TradingCharts
Watch this video to understand the process
instructor
Learn from experienced market practitioners
Darshan serves as the Director and COO of Multyfi (SEBI Reg. No. INH000013475) and brings more than 10 years of experience as a systematic trader, specializing in stock market fund management. Committed to educating and empowering traders, he regularly shares his insights across various platforms and has been featured on prominent news networks, including CNBC, News Capital, and India News.
faq
Everything you need to know before you get started